

Trend Stat
Original · freestats with mini trend sparklines
Copy prompt gives Claude Code, Cursor or v0 a ready-to-paste prompt that recreates this exact component.
npx shadcn@latest add https://webinnoventix.com/r/statx-trend.json"use client";
import {
useEffect,
useId,
useMemo,
useRef,
useState,
type KeyboardEvent as ReactKeyboardEvent,
type PointerEvent as ReactPointerEvent,
} from "react";
import { motion, useReducedMotion } from "motion/react";
type RangeKey = "7d" | "30d" | "90d";
type MetricId = "visitors" | "revenue" | "conversion" | "session";
type AccentKey = "indigo" | "emerald" | "violet" | "sky";
interface Accent {
text: string;
ring: string;
chip: string;
dot: string;
hover: string;
}
interface MetricDef {
id: MetricId;
label: string;
hint: string;
accent: AccentKey;
seed: number;
base: number;
trend: number;
volatility: number;
format: (n: number) => string;
}
interface RangeDef {
key: RangeKey;
label: string;
days: number;
}
interface Point {
x: number;
y: number;
v: number;
}
interface Pad {
l: number;
r: number;
t: number;
b: number;
}
const ACCENTS: Record<AccentKey, Accent> = {
indigo: {
text: "text-indigo-600 dark:text-indigo-400",
ring: "ring-indigo-500/70 dark:ring-indigo-400/70",
chip: "bg-indigo-500/10 text-indigo-700 dark:text-indigo-300",
dot: "bg-indigo-500",
hover: "hover:border-indigo-300 dark:hover:border-indigo-500/60",
},
emerald: {
text: "text-emerald-600 dark:text-emerald-400",
ring: "ring-emerald-500/70 dark:ring-emerald-400/70",
chip: "bg-emerald-500/10 text-emerald-700 dark:text-emerald-300",
dot: "bg-emerald-500",
hover: "hover:border-emerald-300 dark:hover:border-emerald-500/60",
},
violet: {
text: "text-violet-600 dark:text-violet-400",
ring: "ring-violet-500/70 dark:ring-violet-400/70",
chip: "bg-violet-500/10 text-violet-700 dark:text-violet-300",
dot: "bg-violet-500",
hover: "hover:border-violet-300 dark:hover:border-violet-500/60",
},
sky: {
text: "text-sky-600 dark:text-sky-400",
ring: "ring-sky-500/70 dark:ring-sky-400/70",
chip: "bg-sky-500/10 text-sky-700 dark:text-sky-300",
dot: "bg-sky-500",
hover: "hover:border-sky-300 dark:hover:border-sky-500/60",
},
};
const MONTHS = [
"Jan",
"Feb",
"Mar",
"Apr",
"May",
"Jun",
"Jul",
"Aug",
"Sep",
"Oct",
"Nov",
"Dec",
];
const ANCHOR = new Date(2026, 6, 16);
function dayLabel(i: number, n: number): string {
const d = new Date(ANCHOR);
d.setDate(d.getDate() - (n - 1 - i));
return `${MONTHS[d.getMonth()]} ${d.getDate()}`;
}
function countFmt(n: number): string {
return Math.round(n).toLocaleString("en-US");
}
function currencyFmt(n: number): string {
if (n >= 1000) return `$${(n / 1000).toFixed(1)}k`;
return `$${Math.round(n)}`;
}
function percentFmt(n: number): string {
return `${n.toFixed(2)}%`;
}
function durationFmt(n: number): string {
const total = Math.round(n);
const m = Math.floor(total / 60);
const s = total % 60;
return `${m}m ${s.toString().padStart(2, "0")}s`;
}
const METRICS: MetricDef[] = [
{
id: "visitors",
label: "Unique visitors",
hint: "Sessions from new and returning users",
accent: "indigo",
seed: 1487,
base: 11800,
trend: 0.19,
volatility: 0.05,
format: countFmt,
},
{
id: "revenue",
label: "Net revenue",
hint: "Booked revenue after refunds",
accent: "emerald",
seed: 9021,
base: 38400,
trend: 0.27,
volatility: 0.045,
format: currencyFmt,
},
{
id: "conversion",
label: "Checkout rate",
hint: "Visitors who complete a purchase",
accent: "violet",
seed: 3355,
base: 2.84,
trend: 0.16,
volatility: 0.06,
format: percentFmt,
},
{
id: "session",
label: "Avg. session",
hint: "Median engaged time on site",
accent: "sky",
seed: 7712,
base: 274,
trend: -0.09,
volatility: 0.05,
format: durationFmt,
},
];
const RANGES: RangeDef[] = [
{ key: "7d", label: "7 days", days: 7 },
{ key: "30d", label: "30 days", days: 30 },
{ key: "90d", label: "90 days", days: 90 },
];
function mulberry32(seed: number): () => number {
let a = seed >>> 0;
return () => {
a |= 0;
a = (a + 0x6d2b79f5) | 0;
let t = Math.imul(a ^ (a >>> 15), 1 | a);
t = (t + Math.imul(t ^ (t >>> 7), 61 | t)) ^ t;
return ((t ^ (t >>> 14)) >>> 0) / 4294967296;
};
}
function makeSeries(m: MetricDef, length: number): number[] {
const rnd = mulberry32(m.seed + length * 7);
const out: number[] = [];
let v = m.base;
for (let i = 0; i < length; i += 1) {
const drift = 1 + m.trend / length;
const noise = (rnd() - 0.5) * m.volatility;
v = v * drift * (1 + noise);
out.push(Math.max(v, m.base * 0.15));
}
return out;
}
function toPoints(values: number[], w: number, h: number, pad: Pad): Point[] {
const min = Math.min(...values);
const max = Math.max(...values);
const span = max - min || 1;
const iw = w - pad.l - pad.r;
const ih = h - pad.t - pad.b;
const n = values.length;
return values.map((v, i) => ({
x: pad.l + (n === 1 ? 0 : (i / (n - 1)) * iw),
y: pad.t + (1 - (v - min) / span) * ih,
v,
}));
}
function linePath(points: Point[]): string {
return points
.map((p, i) => `${i === 0 ? "M" : "L"}${p.x.toFixed(2)} ${p.y.toFixed(2)}`)
.join(" ");
}
function areaPath(points: Point[], baseline: number): string {
if (points.length === 0) return "";
const first = points[0];
const last = points[points.length - 1];
return `${linePath(points)} L${last.x.toFixed(2)} ${baseline.toFixed(
2,
)} L${first.x.toFixed(2)} ${baseline.toFixed(2)} Z`;
}
function TrendArrow({ up }: { up: boolean }) {
return (
<svg
viewBox="0 0 12 12"
className="h-3 w-3"
aria-hidden="true"
fill="none"
stroke="currentColor"
strokeWidth={1.8}
strokeLinecap="round"
strokeLinejoin="round"
>
{up ? (
<path d="M3 8.5 6.2 4.2 8.4 6.6 10.5 3.2M10.5 3.2H7.9M10.5 3.2V5.8" />
) : (
<path d="M3 3.5 6.2 7.8 8.4 5.4 10.5 8.8M10.5 8.8H7.9M10.5 8.8V6.2" />
)}
</svg>
);
}
function DeltaBadge({ delta }: { delta: number }) {
const up = delta >= 0;
const tone = up
? "bg-emerald-500/10 text-emerald-700 dark:text-emerald-300"
: "bg-rose-500/10 text-rose-700 dark:text-rose-300";
return (
<span
className={`inline-flex items-center gap-1 rounded-full px-2 py-0.5 text-xs font-semibold tabular-nums ${tone}`}
>
<TrendArrow up={up} />
{up ? "+" : "−"}
{Math.abs(delta).toFixed(1)}%
</span>
);
}
function Sparkline({
values,
accent,
}: {
values: number[];
accent: Accent;
}) {
const gid = useId().replace(/:/g, "");
const W = 128;
const H = 40;
const pad: Pad = { l: 2, r: 2, t: 6, b: 6 };
const points = toPoints(values, W, H, pad);
const last = points[points.length - 1];
return (
<svg
viewBox={`0 0 ${W} ${H}`}
className={`h-10 w-full overflow-visible ${accent.text}`}
preserveAspectRatio="none"
aria-hidden="true"
>
<defs>
<linearGradient id={`spark-${gid}`} x1="0" y1="0" x2="0" y2="1">
<stop offset="0%" stopColor="currentColor" stopOpacity={0.28} />
<stop offset="100%" stopColor="currentColor" stopOpacity={0} />
</linearGradient>
</defs>
<path d={areaPath(points, H - pad.b)} fill={`url(#spark-${gid})`} />
<path
d={linePath(points)}
fill="none"
stroke="currentColor"
strokeWidth={1.75}
strokeLinecap="round"
strokeLinejoin="round"
vectorEffect="non-scaling-stroke"
/>
{last ? (
<circle
cx={last.x}
cy={last.y}
r={2.4}
fill="currentColor"
vectorEffect="non-scaling-stroke"
/>
) : null}
</svg>
);
}
const VIEW_W = 760;
const VIEW_H = 260;
const FPAD: Pad = { l: 16, r: 16, t: 22, b: 34 };
const PLOT_W = VIEW_W - FPAD.l - FPAD.r;
const BASELINE_Y = VIEW_H - FPAD.b;
export default function StatxTrend() {
const reduce = useReducedMotion();
const [range, setRange] = useState<RangeKey>("30d");
const [selectedMetric, setSelectedMetric] = useState<MetricId>("revenue");
const [cursor, setCursor] = useState<number>(0);
const rangeRefs = useRef<Array<HTMLButtonElement | null>>([]);
const cardRefs = useRef<Array<HTMLButtonElement | null>>([]);
const featuredSvgRef = useRef<SVGSVGElement | null>(null);
const rangeDays = useMemo(
() => RANGES.find((r) => r.key === range)?.days ?? 30,
[range],
);
const seriesByMetric = useMemo<Record<MetricId, number[]>>(() => {
const entries = METRICS.map(
(m) => [m.id, makeSeries(m, rangeDays)] as const,
);
return {
visitors: entries[0][1],
revenue: entries[1][1],
conversion: entries[2][1],
session: entries[3][1],
};
}, [rangeDays]);
const activeMetric = useMemo(
() => METRICS.find((m) => m.id === selectedMetric) ?? METRICS[0],
[selectedMetric],
);
const featuredValues = seriesByMetric[selectedMetric];
const n = featuredValues.length;
const featuredPoints = useMemo(
() => toPoints(featuredValues, VIEW_W, VIEW_H, FPAD),
[featuredValues],
);
useEffect(() => {
setCursor(n - 1);
}, [range, selectedMetric, n]);
const clamped = Math.max(0, Math.min(n - 1, cursor));
const activeAccent = ACCENTS[activeMetric.accent];
const cursorPoint = featuredPoints[clamped];
const cursorValue = featuredValues[clamped];
const cursorDate = dayLabel(clamped, n);
const featuredDelta = useMemo(() => {
const first = featuredValues[0];
const last = featuredValues[n - 1];
if (!first) return 0;
return ((last - first) / first) * 100;
}, [featuredValues, n]);
const peak = Math.max(...featuredValues);
const trough = Math.min(...featuredValues);
const average =
featuredValues.reduce((sum, v) => sum + v, 0) / (n || 1);
const scrubFromClientX = (clientX: number) => {
const svg = featuredSvgRef.current;
if (!svg) return;
const rect = svg.getBoundingClientRect();
if (rect.width === 0) return;
const vx = ((clientX - rect.left) / rect.width) * VIEW_W;
const ratio = (vx - FPAD.l) / PLOT_W;
const idx = Math.round(ratio * (n - 1));
setCursor(Math.max(0, Math.min(n - 1, idx)));
};
const onPlotPointer = (e: ReactPointerEvent<SVGRectElement>) => {
scrubFromClientX(e.clientX);
};
const onSliderKey = (e: ReactKeyboardEvent<HTMLDivElement>) => {
let next = clamped;
switch (e.key) {
case "ArrowRight":
case "ArrowUp":
next = Math.min(n - 1, clamped + 1);
break;
case "ArrowLeft":
case "ArrowDown":
next = Math.max(0, clamped - 1);
break;
case "PageUp":
next = Math.min(n - 1, clamped + 7);
break;
case "PageDown":
next = Math.max(0, clamped - 7);
break;
case "Home":
next = 0;
break;
case "End":
next = n - 1;
break;
default:
return;
}
e.preventDefault();
setCursor(next);
};
const onRangeKey = (
e: ReactKeyboardEvent<HTMLButtonElement>,
idx: number,
) => {
const len = RANGES.length;
let ni = idx;
switch (e.key) {
case "ArrowRight":
case "ArrowDown":
ni = (idx + 1) % len;
break;
case "ArrowLeft":
case "ArrowUp":
ni = (idx - 1 + len) % len;
break;
case "Home":
ni = 0;
break;
case "End":
ni = len - 1;
break;
default:
return;
}
e.preventDefault();
setRange(RANGES[ni].key);
rangeRefs.current[ni]?.focus();
};
const onCardKey = (
e: ReactKeyboardEvent<HTMLButtonElement>,
idx: number,
) => {
const len = METRICS.length;
let ni = idx;
switch (e.key) {
case "ArrowRight":
case "ArrowDown":
ni = (idx + 1) % len;
break;
case "ArrowLeft":
case "ArrowUp":
ni = (idx - 1 + len) % len;
break;
case "Home":
ni = 0;
break;
case "End":
ni = len - 1;
break;
default:
return;
}
e.preventDefault();
setSelectedMetric(METRICS[ni].id);
cardRefs.current[ni]?.focus();
};
const tickIdx = [0, Math.floor((n - 1) / 2), n - 1];
const gradId = `feat-${activeMetric.id}`;
const drawKey = `${selectedMetric}-${range}`;
const focusRing =
"focus-visible:outline-none focus-visible:ring-2 focus-visible:ring-offset-2 focus-visible:ring-offset-white dark:focus-visible:ring-offset-slate-950";
return (
<section className="relative w-full overflow-hidden bg-slate-50 px-4 py-16 text-slate-900 sm:px-6 sm:py-20 lg:py-24 dark:bg-slate-950 dark:text-slate-100">
<style>{`
@keyframes statx-pulse {
0%, 100% { opacity: 0.45; transform: scale(1); }
50% { opacity: 1; transform: scale(1.6); }
}
.statx-pulse-dot { animation: statx-pulse 2.4s ease-in-out infinite; transform-origin: center; }
@media (prefers-reduced-motion: reduce) {
.statx-pulse-dot { animation: none !important; }
}
`}</style>
<div
aria-hidden="true"
className="pointer-events-none absolute inset-x-0 top-0 -z-10 h-72 bg-[radial-gradient(60%_100%_at_50%_0%,rgba(99,102,241,0.12),transparent)]"
/>
<div className="mx-auto max-w-5xl">
<header className="flex flex-col gap-6 sm:flex-row sm:items-end sm:justify-between">
<div className="max-w-xl">
<div className="mb-3 inline-flex items-center gap-2 rounded-full border border-slate-200 bg-white/70 px-3 py-1 text-xs font-medium text-slate-600 dark:border-slate-800 dark:bg-slate-900/70 dark:text-slate-300">
<span className="relative flex h-2 w-2">
<span className="statx-pulse-dot absolute inline-flex h-full w-full rounded-full bg-emerald-500" />
<span className="relative inline-flex h-2 w-2 rounded-full bg-emerald-500" />
</span>
Live workspace · synced 2 min ago
</div>
<h2 className="text-2xl font-semibold tracking-tight sm:text-3xl">
Growth pulse
</h2>
<p className="mt-2 text-sm leading-relaxed text-slate-600 dark:text-slate-400">
Four signals from the storefront, each with its own trend line.
Pick a metric to inspect it, then scrub the timeline to read any
day.
</p>
</div>
<div
role="radiogroup"
aria-label="Select time range"
className="inline-flex shrink-0 rounded-xl border border-slate-200 bg-white p-1 shadow-sm dark:border-slate-800 dark:bg-slate-900"
>
{RANGES.map((r, idx) => {
const on = r.key === range;
return (
<button
key={r.key}
ref={(el) => {
rangeRefs.current[idx] = el;
}}
type="button"
role="radio"
aria-checked={on}
tabIndex={on ? 0 : -1}
onClick={() => setRange(r.key)}
onKeyDown={(e) => onRangeKey(e, idx)}
className={`rounded-lg px-3 py-1.5 text-sm font-medium transition-colors ${focusRing} focus-visible:ring-indigo-500 ${
on
? "bg-slate-900 text-white shadow-sm dark:bg-white dark:text-slate-900"
: "text-slate-500 hover:text-slate-900 dark:text-slate-400 dark:hover:text-slate-100"
}`}
>
{r.label}
</button>
);
})}
</div>
</header>
<div className="mt-8 overflow-hidden rounded-2xl border border-slate-200 bg-white shadow-sm dark:border-slate-800 dark:bg-slate-900">
<div className="flex flex-col gap-4 border-b border-slate-100 p-6 sm:flex-row sm:items-start sm:justify-between dark:border-slate-800">
<div>
<div className="flex items-center gap-2">
<span className={`h-2.5 w-2.5 rounded-full ${activeAccent.dot}`} />
<span className="text-sm font-medium text-slate-500 dark:text-slate-400">
{activeMetric.label}
</span>
</div>
<div className="mt-2 flex items-baseline gap-3">
<span className="text-3xl font-semibold tabular-nums tracking-tight sm:text-4xl">
{activeMetric.format(cursorValue)}
</span>
<DeltaBadge delta={featuredDelta} />
</div>
<p className="mt-1 text-sm text-slate-500 dark:text-slate-400">
{cursorDate} · {activeMetric.hint}
</p>
</div>
<dl className="grid grid-cols-3 gap-4 text-right sm:gap-6">
{[
{ k: "Peak", v: activeMetric.format(peak) },
{ k: "Average", v: activeMetric.format(average) },
{ k: "Low", v: activeMetric.format(trough) },
].map((s) => (
<div key={s.k}>
<dt className="text-xs font-medium uppercase tracking-wide text-slate-400 dark:text-slate-500">
{s.k}
</dt>
<dd className="mt-1 text-sm font-semibold tabular-nums text-slate-700 dark:text-slate-200">
{s.v}
</dd>
</div>
))}
</dl>
</div>
<div className="p-4 sm:p-6">
<div
role="slider"
tabIndex={0}
aria-label={`Scrub ${activeMetric.label} timeline`}
aria-valuemin={0}
aria-valuemax={n - 1}
aria-valuenow={clamped}
aria-valuetext={`${cursorDate}: ${activeMetric.format(
cursorValue,
)}`}
onKeyDown={onSliderKey}
className={`group relative block w-full rounded-xl ${focusRing} focus-visible:ring-indigo-500`}
>
<svg
ref={featuredSvgRef}
viewBox={`0 0 ${VIEW_W} ${VIEW_H}`}
className={`h-56 w-full touch-none ${activeAccent.text}`}
role="img"
aria-label={`${activeMetric.label} over the last ${rangeDays} days`}
>
<defs>
<linearGradient id={gradId} x1="0" y1="0" x2="0" y2="1">
<stop
offset="0%"
stopColor="currentColor"
stopOpacity={0.24}
/>
<stop
offset="100%"
stopColor="currentColor"
stopOpacity={0}
/>
</linearGradient>
</defs>
{[0, 1, 2, 3, 4].map((g) => {
const y = FPAD.t + (g / 4) * (VIEW_H - FPAD.t - FPAD.b);
return (
<line
key={g}
x1={FPAD.l}
x2={VIEW_W - FPAD.r}
y1={y}
y2={y}
className="stroke-slate-100 dark:stroke-slate-800"
strokeWidth={1}
/>
);
})}
<motion.path
key={`area-${drawKey}`}
d={areaPath(featuredPoints, BASELINE_Y)}
fill={`url(#${gradId})`}
initial={{ opacity: reduce ? 1 : 0 }}
animate={{ opacity: 1 }}
transition={{ duration: reduce ? 0 : 0.6, ease: "easeOut" }}
/>
<motion.path
key={`line-${drawKey}`}
d={linePath(featuredPoints)}
fill="none"
stroke="currentColor"
strokeWidth={2.25}
strokeLinecap="round"
strokeLinejoin="round"
initial={{ pathLength: reduce ? 1 : 0 }}
animate={{ pathLength: 1 }}
transition={{
duration: reduce ? 0 : 0.9,
ease: "easeInOut",
}}
/>
{cursorPoint ? (
<g>
<line
x1={cursorPoint.x}
x2={cursorPoint.x}
y1={FPAD.t}
y2={BASELINE_Y}
className="stroke-slate-300 dark:stroke-slate-600"
strokeWidth={1}
strokeDasharray="3 3"
/>
<circle
cx={cursorPoint.x}
cy={cursorPoint.y}
r={6}
fill="currentColor"
opacity={0.18}
/>
<circle
cx={cursorPoint.x}
cy={cursorPoint.y}
r={3.5}
fill="currentColor"
className="stroke-white dark:stroke-slate-900"
strokeWidth={2}
/>
</g>
) : null}
{tickIdx.map((ti, k) => {
const p = featuredPoints[ti];
if (!p) return null;
const anchor =
k === 0 ? "start" : k === tickIdx.length - 1 ? "end" : "middle";
return (
<text
key={ti}
x={p.x}
y={VIEW_H - 12}
textAnchor={anchor}
className="fill-slate-400 text-[11px] dark:fill-slate-500"
>
{dayLabel(ti, n)}
</text>
);
})}
<rect
x={FPAD.l}
y={FPAD.t}
width={PLOT_W}
height={VIEW_H - FPAD.t - FPAD.b}
fill="transparent"
onPointerDown={onPlotPointer}
onPointerMove={onPlotPointer}
style={{ cursor: "ew-resize" }}
/>
</svg>
</div>
<p className="mt-3 text-center text-xs text-slate-400 dark:text-slate-500">
Drag across the chart or use arrow keys to inspect a day
</p>
</div>
</div>
<div
role="radiogroup"
aria-label="Choose a metric to feature"
className="mt-6 grid grid-cols-1 gap-4 sm:grid-cols-2 lg:grid-cols-4"
>
{METRICS.map((m, idx) => {
const values = seriesByMetric[m.id];
const first = values[0];
const last = values[values.length - 1];
const delta = first ? ((last - first) / first) * 100 : 0;
const accent = ACCENTS[m.accent];
const on = m.id === selectedMetric;
return (
<motion.button
key={m.id}
ref={(el) => {
cardRefs.current[idx] = el;
}}
type="button"
role="radio"
aria-checked={on}
tabIndex={on ? 0 : -1}
onClick={() => setSelectedMetric(m.id)}
onKeyDown={(e) => onCardKey(e, idx)}
initial={reduce ? false : { opacity: 0, y: 12 }}
animate={{ opacity: 1, y: 0 }}
transition={{
duration: reduce ? 0 : 0.4,
delay: reduce ? 0 : idx * 0.06,
ease: "easeOut",
}}
className={`flex flex-col rounded-2xl border bg-white p-5 text-left shadow-sm transition-colors ${focusRing} focus-visible:ring-indigo-500 dark:bg-slate-900 ${
on
? `border-transparent ring-2 ${accent.ring}`
: `border-slate-200 dark:border-slate-800 ${accent.hover}`
}`}
>
<div className="flex items-center justify-between">
<span className="text-sm font-medium text-slate-500 dark:text-slate-400">
{m.label}
</span>
<span
className={`rounded-md px-1.5 py-0.5 text-[10px] font-semibold uppercase tracking-wide ${accent.chip}`}
>
{range}
</span>
</div>
<div className="mt-2 flex items-baseline justify-between gap-2">
<span className="text-2xl font-semibold tabular-nums tracking-tight">
{m.format(last)}
</span>
<DeltaBadge delta={delta} />
</div>
<div className="mt-4">
<Sparkline values={values} accent={accent} />
</div>
</motion.button>
);
})}
</div>
</div>
</section>
);
}Dependencies
Licence
Built by Web Innoventix. Free for personal and commercial use, no attribution required.
Built by Web Innoventix
Need a custom interface, a full website, or SEO that gets you cited by AI? We design, build and rank it end to end.
Get a free quoteSimilar components
Browse all →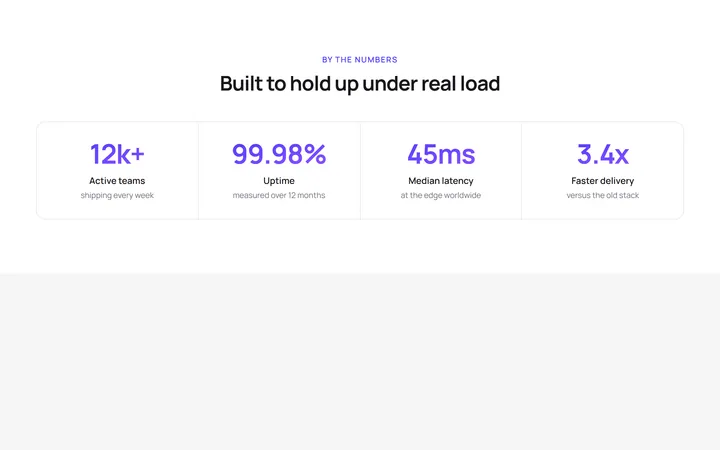
Four Stat Metric Band
OriginalA four-column metric band with gradient figures inside a hairline-divided card, ideal for headline numbers like uptime, latency and growth.
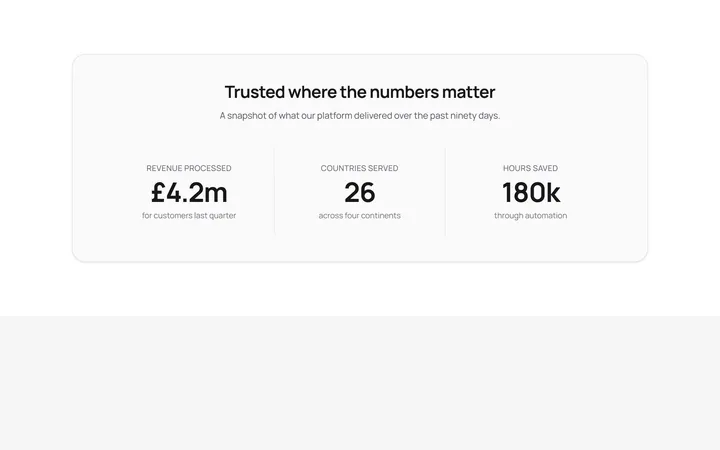
Labelled Stats With Dividers
OriginalThree centred stats separated by responsive dividers, each pairing a headline figure with an uppercase label and supporting detail.
Trusted By Logo Cloud
OriginalA responsive six-up logo strip using simple inline-SVG marks and wordmarks with a grayscale-to-colour hover, for a trusted-by section.
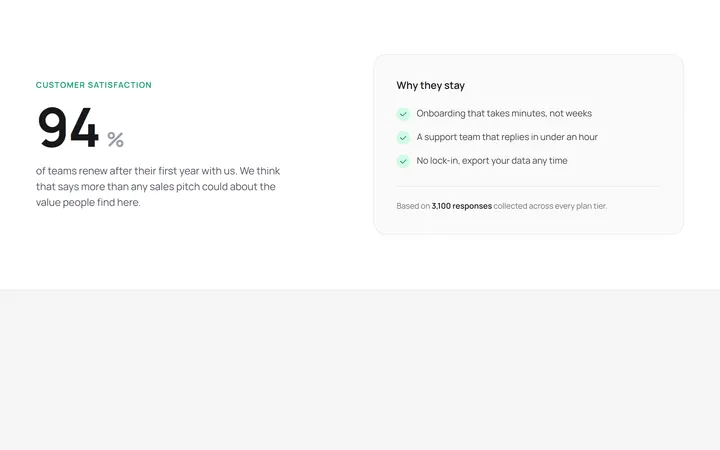
Hero Stat With Supporting Copy
OriginalA two-column layout pairing one oversized hero statistic with a supporting paragraph and a checklist card explaining the number.
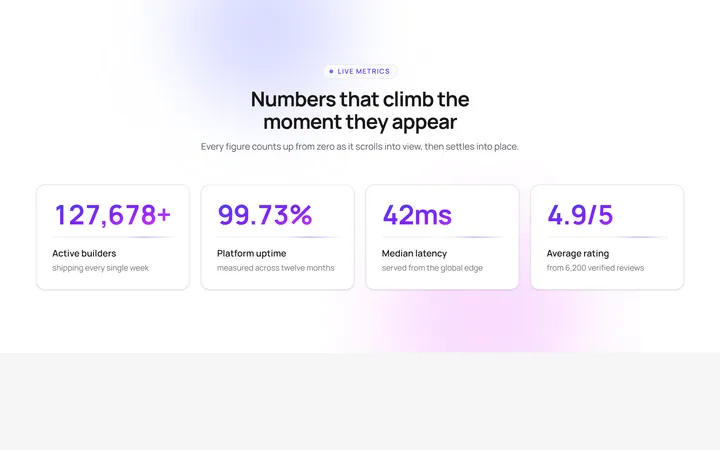
Count-up stats reveal
OriginalA four-card stat band whose gradient numbers count up from zero as the section scrolls into view, with staggered blur-in cards, a pulsing eyebrow, floating aurora blobs and a shimmering underline sweep.
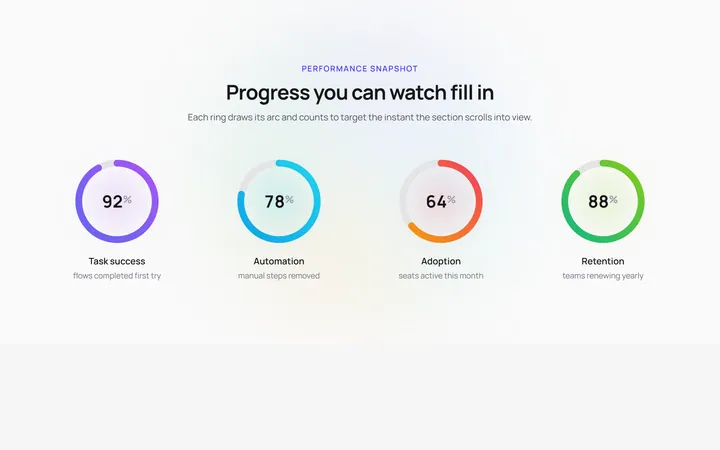
Animated SVG progress rings
OriginalFour circular SVG progress rings that draw their gradient arcs and count up to their target percentage the moment they enter view, over a slowly rotating conic halo with a soft glow pulse behind each ring.
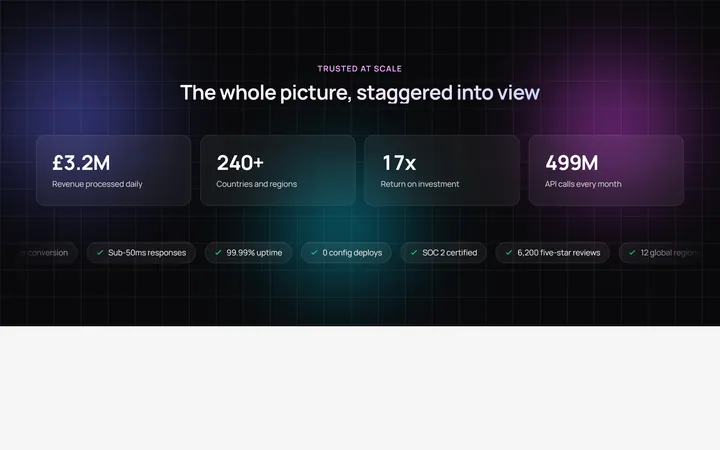
Staggered stat band with marquee ticker
OriginalA dark stat band where 3D-tilt cards stagger into view with count-up figures over an animated gradient mesh, finished by an infinite marquee ticker of highlight chips that pauses on hover.
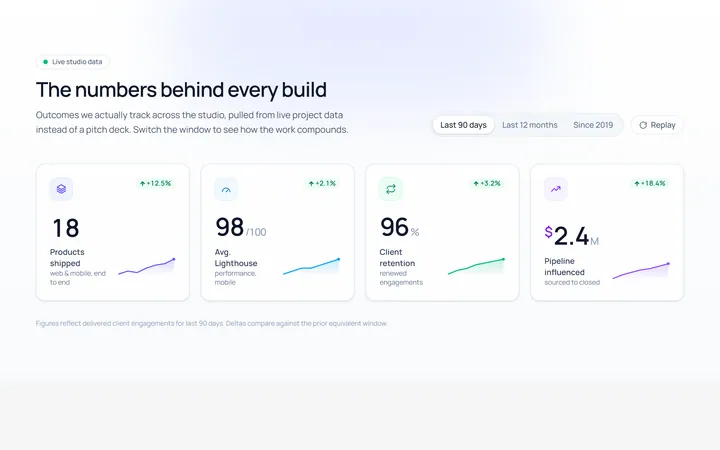
Counter Row Stat
Originalanimated counter stats row
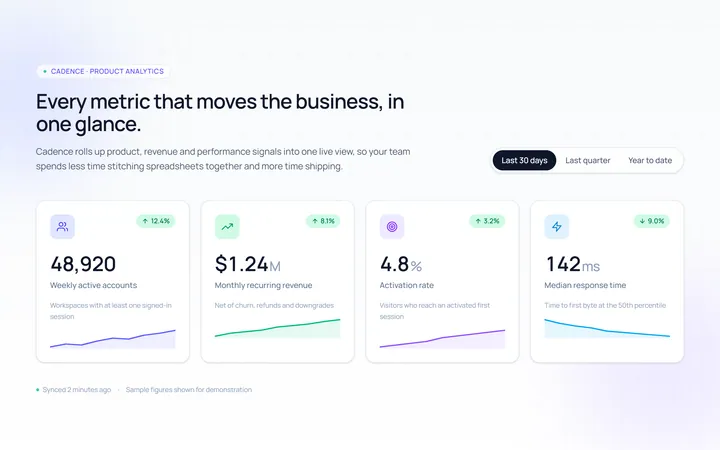
Cards Stat
Originalstat cards with icons
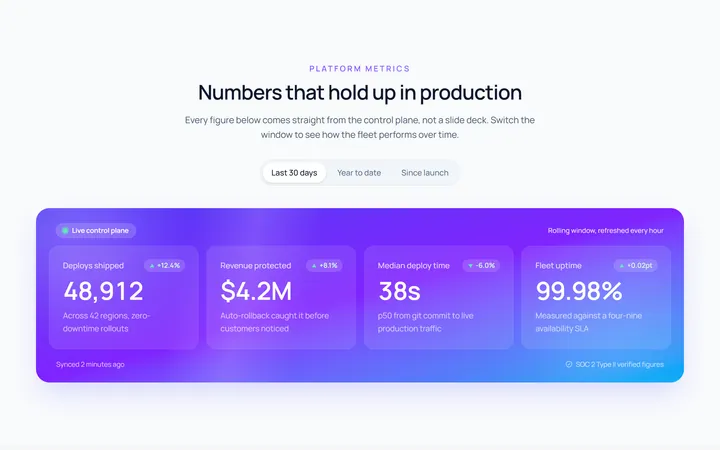
Gradient Stat
Originalgradient stats band
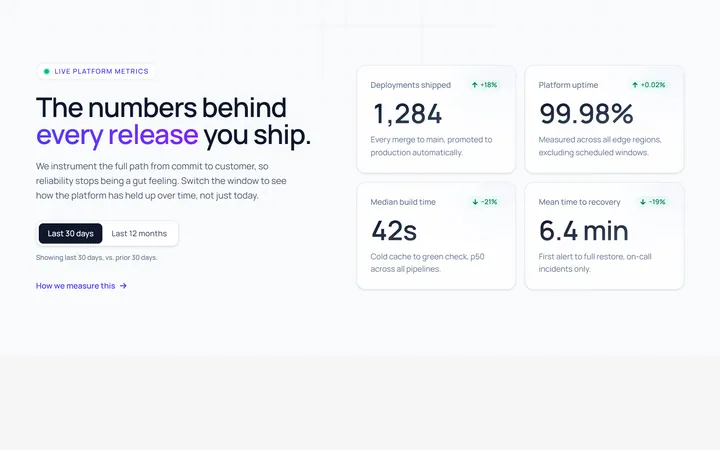
Split Stat
Originalstats beside copy
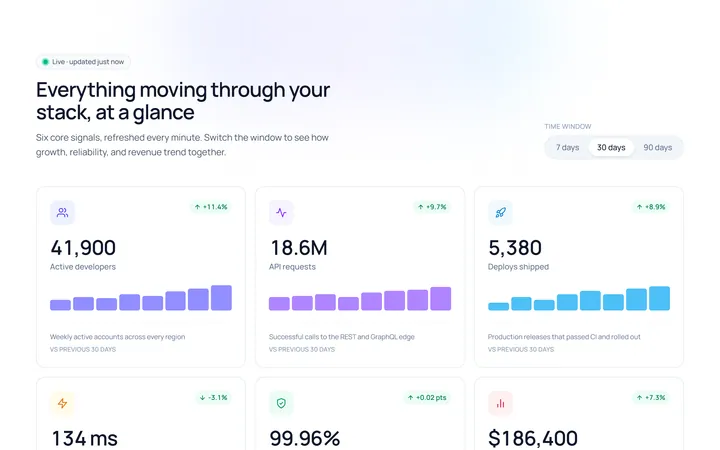
Icons Stat
Originalicon stat grid